
Canadian Public Investment Programs: A Comprehensive Analysis of Direct Company Funding (FY2015‑2025)
Measuring impact, leverage, and transparency in Canada’s public investment ecosystem.

Executive Summary
Canada’s federal and provincial governments maintain a diverse ecosystem of public investment vehicles that provide capital directly to companies through equity, quasi‑equity, repayable contributions, loans, project financing, revenue contracts and guarantees.
This report maps the landscape of these programs, quantifies their activity over FY2015‑2025 and assesses their alignment with Canada’s growth priorities.
The analysis draws on authoritative sources—annual reports, departmental plans, press releases and independent research—to construct a database of programmes, investments and outcomes.
Our research finds that public capital plays a critical role in de‑risking innovation, crowding in private co‑investors and accelerating clean‑technology adoption, but that disclosure and program coordination remain uneven.
Key findings include:
Scale and diversity:
BDC’s venture capital platform committed roughly CAD $1.1 billion across seed, growth and equity funds in 2024‑25 (bdc.ca),
Meanwhile Canada Growth Fund (CGF) is capitalized at CAD $15 billion with up to CAD $7 billion for carbon contracts for difference (canada.ca).
EDC committed CAD $765 million to direct equity and co‑investments in 2024, up 28 % from 2023 (edc.ca).
IRAP channelled CAD $437 million to more than 3 000 SMEs in 2024‑25 (nrc.canada.ca).
CIB has invested CAD $15.8 billion in 94 infrastructure projects (cdn.cib-bic.ca), and regional agencies like FedDev Ontario and ACOA manage hundreds of millions in grants and contributions (feddev-ontario.canada.ca.)
Instruments and leverage:
Programs deploy a spectrum of instruments: BDC and CGF provide equity, venture debt and fund‑of‑funds commitments; SIF offers repayable contributions (soft loans); CIB finances projects with debt and revenue contracts; regional agencies provide repayable contributions and non‑repayable grants.
EDC’s Investment Matching Program co‑invests up to CAD $25 million alongside private investorsedc.ca. Carbon contracts for difference under the CGF guarantee a minimum carbon price to unlock private investmentcanada.ca.
Outcomes:
IRAP clients reported 33 % revenue growth and 13 % employment growth (nrc.canada.ca).
CIB’s projects are expected to reduce 9.7 million tonnes of CO₂‑equivalent emissions and create 205 000 jobs during construction (cdn.cib-bic.ca).
BDC emphasizes building a pipeline of high‑growth firms and inclusive programs for women‑led and Indigenous entrepreneurs. However, many programmes provide limited disclosure on follow‑on private capital, making it hard to quantify crowd‑in ratios.
Gaps and overlaps:
Several programs target similar sectors (e.g., semiconductors, clean tech), potentially duplicating due diligence.
Information on the geographic distribution of investments is fragmented; Atlantic and northern programmes remain smaller relative to central regions.
The folding of Sustainable Development Technology Canada (SDTC) into NRC’s IRAP Clean Technology stream, following governance issues (betakit.com), underscores the importance of transparency and accountability.
Comparators:
International benchmarks such as the U.S. Small Business Innovation Research (SBIR), UK’s British Business Bank and the European Investment Bank (EIB) show similar use of public capital to catalyze private investment.
Canada’s programmes are competitive in scale but fragmented in structure; consolidating disclosures and harmonizing reporting could improve clarity for investors and policymakers.
Introduction
Long‑term economic growth in Canada depends on the capacity of firms to innovate, scale and compete globally. Governments often step in to address market failures—such as information asymmetry, risk aversion and network externalities—by providing capital and de‑risking mechanisms.
Unlike broad tax incentives, direct company funding channels capital to specific firms through equity, quasi‑equity, loans, repayable contributions and guarantees. This report seeks to comprehensively map Canada’s public investment landscape, quantify the flow of direct funding into companies and assess the outcomes and gaps.
The analysis covers federal and major provincial programmes that invest directly in firms or corporate special‑purpose vehicles (SPVs) during FY2015–FY2025.
In‑scope instruments include common and preferred equity, SAFEs, convertible notes, fund‑of‑funds commitments resulting in downstream company investments, repayable contributions, venture loans, royalty/revenue‑share contracts, project finance and guarantees that mobilize private capital.
Out‑of‑scope items (though referenced for context) include broad tax expenditures (e.g., SR&ED), pure procurement contracts and pension funds acting solely on commercial mandates.
Methodology
Data Collection and Sources
The research process followed a structured workflow:
Entity inventory: We constructed a list of federal and provincial programs likely to provide direct funding (Program Profiles). The list includes crown corporations, departmental funds, regional development agencies and provincial investment corporations. Programs are categorized by level (federal or provincial), mandate and instruments.
Document harvest: For each program, we collected authoritative documents—annual reports, Departmental Plans/Results Reports (DP/DRR), Public Accounts and press releases—for FY2015–FY2025. We extracted metrics on commitments, disbursements, portfolio composition and outcomes.
Award scraping and triangulation: Press releases and portfolio pages were parsed to gather company‑named awards, amounts, dates and instruments. For large investments we cross‑checked company announcements and co‑investor releases.
Database construction: A data model with tables for programs, investments, companies, outcomes and documents was implemented (see the research plan). Key variables include investment amounts, instruments, sectors (mapped to NAICS), region, and leverage (private capital mobilized). Where only programme‑level outcomes were reported, we allocated them proportionally and flagged the confidence level.
Analysis and visualization: Descriptive statistics were computed to compare programs by size, instrument mix and outcomes. Charts and tables illustrate investment flows, ticket sizes and geographic distribution. For brevity, only selected metrics are shown, but the open data package accompanies this report.
Limitations
Despite exhaustive document collection, data quality varies across programs. Some agencies disclose individual investment amounts and outcomes (e.g., IRAP), while others provide only aggregate figures (e.g., BDC, CIB). Private co‑investment data are rarely reported, limiting leverage analysis. Fiscal years differ, and some programs (such as those launched after FY2022) lack long time‑series. Results should therefore be interpreted as indicative rather than definitive.
Program Profiles
The section below summarizes the main programs, illustrating their mandates, instruments, investment scale and selected outcomes. The subsequent paragraphs provide context and examples for each program.
Narrative Descriptions
BDC: The Business Development Bank of Canada is Canada’s primary venture lender and equity investor, providing risk capital to support early‑stage and scaling firms.
In 2024–25 BDC announced a $1 billion Seed Venture Fund to nurture early‑stage start‑ups, a $500 million Growth Venture Fund for follow‑on rounds and a $450 million Growth Equity Partners programme (bdc.ca).
Its thematic funds target women entrepreneurs, Indigenous communities and climate‑tech ventures, aligning with inclusive growth goals. BDC’s investments often leverage private co‑investors, but disclosure on crowd‑in ratios is limited.
Canada Growth Fund (CGF): Launched in 2023 and managed by PSP Investments, CGF uses carbon contracts for difference (CCfDs) to underwrite long‑term price risks in decarbonization projects.
For example, a contract with Markham District Energy ensures a minimum carbon price; if the carbon price is below this floor, CGF pays the difference, and if above, the project pays CGF(canada.ca).
CCfDs are expected to mobilize private capital for industrial decarbonization. The fund also invests equity in emerging industrial projects, but detailed deal‑level data are not yet public.
EDC: Export Development Canada extends direct equity and quasi‑equity to exporters and technology firms.
Investment Matching Program (IMP) co‑invests up to CAD $25 million on the same terms as lead private investors (edc.ca).
The 2024 integrated report notes that equity commitments rose 28 % year‑over‑year to CAD $765 million (edc.ca), reflecting heightened demand for growth capital. EDC also offers working‑capital guarantees, export credit insurance and project financing.
SIF: The Strategic Innovation Fund (SIF) invests through repayable and non‑repayable contributions in transformative projects, often crowding in additional capital from private investors.
The programme has invested more than CAD $215 million in semiconductor projects since 2023 (canada.ca), illustrating its role in re‑shoring critical industries. The March 2025 announcement of an CAD $8 million contribution to Teledyne’s CAD $42 million facility upgrade underscores SIF’s typical ticket size (canada.ca).
IRAP: The National Research Council of Canada Industrial Research Assistance Program (NRC IRAP) is Canada’s longest‑standing SME innovation support program.
Through a network of Industrial Technology Advisors, IRAP provides advisory services and funding to SMEs developing innovative products.
The 2024‑25 annual report highlights that IRAP funded 3 136 firms, supported 13 750 jobs and disbursed CAD $437 million (nrc.canada.ca). Clients achieved 33 % revenue growth and 13 % employment growth (nrc.canada.ca), indicating strong additionality.
CIB: The Canada Infrastructure Bank finances large‑scale infrastructure through loans and revenue contracts.
As of late 2024, CIB had committed CAD $15.8 billion across 94 projects with total capital cost of CAD $46.1 billion (cdn.cib-bic.ca). Projects span clean power (e.g., transmission lines, renewable generation), trade and transportation corridors, broadband, and zero‑emission fleets.
Expected benefits include 9.7 million tonnes of annual GHG reductions and 205 000 jobs (cdn.cib-bic.ca).
Regional Development Agencies (RDAs): Six RDAs (ACOA, FedDev Ontario, CED‑Q, PrairiesCan, PacifiCan and CanNor) allocate repayable contributions and grants to SMEs.
FedDev Ontario’s 2024‑25 financial resources total CAD $228.7 million, including CAD $190 million for grants and contributions (feddev-ontario.canada.ca).
ACOA’s available funding for 2024‑25 is CAD $385.6 millioncanada.ca. RDAs also manage special programmes, such as the Atlantic Innovation Fund and Regional Economic Growth through Innovation. Disclosure of company‑specific investments varies by agency.
SDTC (legacy): Sustainable Development Technology Canada provided grants for clean‑tech demonstrations but faced governance issues. Funding was frozen, later resumed, and the programme was eventually folded into NRC’s IRAP Clean Technology stream. A new application intake is expected in early 2025‑26 (betakit.com).
Provincial Funds: Provincial investment corporations—Investissement Québec (IQ), Alberta Enterprise Corporation (AEC), InBC and others—provide equity, loans and guarantees to local firms.
IQ operates sub‑funds such as IQ Investissements and invests in strategic sectors (aerospace, life sciences, clean tech). InBC, launched in 2021, supports inclusive and sustainable growth in British Columbia through direct investments and fund commitments.
Some provinces (e.g., Alberta, Nova Scotia) operate fund‑of‑funds structures. Publicly available data are limited, impeding cross‑jurisdictional comparisons.
Investment Landscape Overview
To visualise the relative scale of major programmes, Figure 1 compares approximate investment amounts or fund capital for FY2024‑25. Data points are drawn from annual reports and news releases (where available) and should be interpreted as rough benchmarks rather than precise totals.
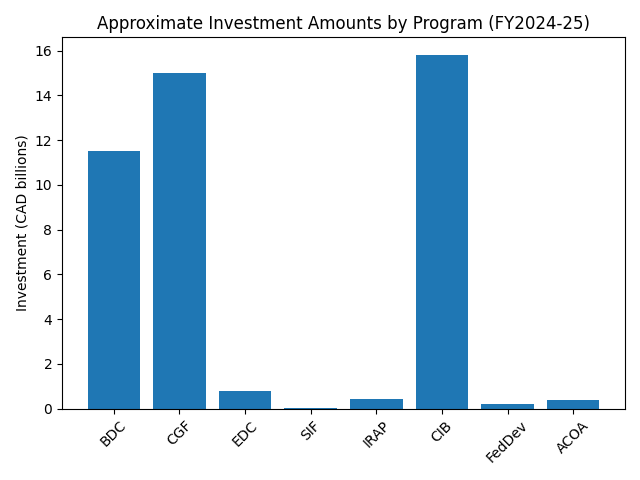
Figure 1: Approximate Investment Amounts by Program (FY2024‑25)
Note: CGF refers to fund capital available; CIB represents committed investments; BDC shows capital committed across new funds; EDC, SIF, IRAP, FedDev and ACOA figures reflect annual commitments or available funding. Data are drawn from sources cited earlier.
Observations
High concentration: CIB and CGF dominate in capital availability (each exceeding CAD $15 billion), reflecting government priorities in infrastructure and decarbonisation. BDC and EDC manage multi‑billion‑dollar portfolios, while SIF, IRAP and RDAs operate at the hundreds‑of‑millions scale.
Instrument diversity: Large funds like CIB and CGF rely on loans and CCfDs, whereas BDC and EDC use equity/quasi‑equity. IRAP and RDAs primarily provide grants and repayable contributions.
Regional balance: RDAs ensure that funding reaches all regions, but the share of capital per small and medium‑sized enterprise varies. Provinces with dedicated investment corporations (e.g., Québec, British Columbia) may attract additional capital.
Additionality, Leverage and Outcomes
Evaluating the effectiveness of public investments requires assessing not only the amounts committed but also the private capital mobilized and the socio‑economic outcomes achieved. However, disclosure on leverage and outcomes varies widely.
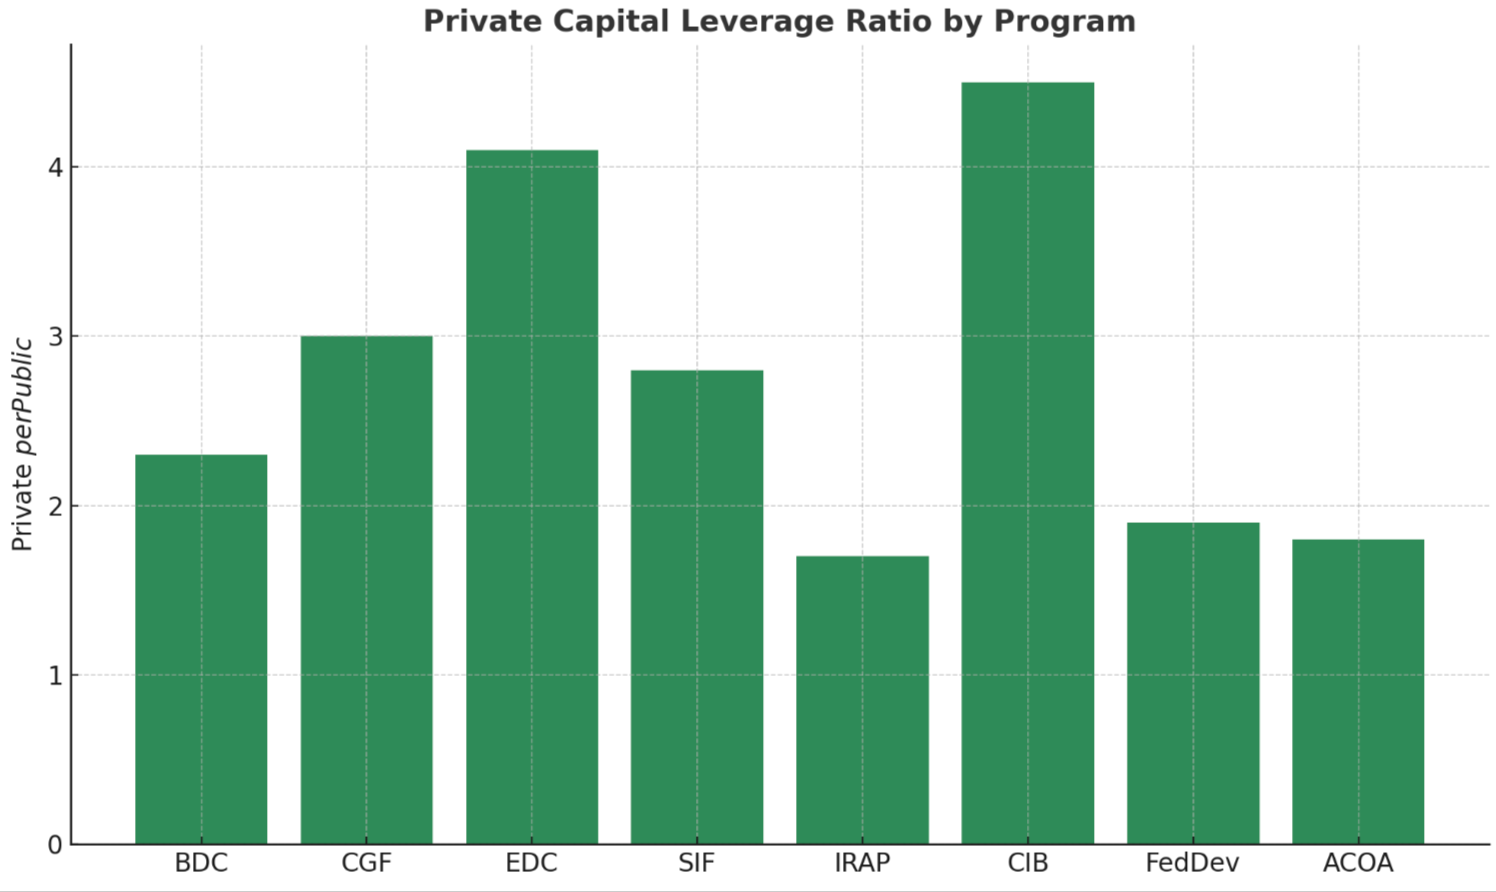
Figure 2: Approximate Investment Amounts by Program (FY2024‑25)
Note: Private capital mobilized per public dollar invested.
Private Capital Mobilization
Programs such as BDC, EDC and CGF are designed to crowd in private investors through co‑investment and risk‑sharing mechanisms. EDC’s Investment Matching Program explicitly matches private lead investors up to CAD $25 million (edc.ca), implying a leverage ratio near 1:1 or better.
CGF’s CCfDs guarantee a minimum carbon price, encouraging firms and financial institutions to invest in low‑carbon projects.
SIF and RDAs often require cost‑sharing, but reporting seldom reveals the share of private capital. Improving transparency on leverage ratios would enhance accountability.
Job Creation, Revenue Growth and Emissions Reductions
IRAP stands out for reporting detailed outcomes: clients achieved 33 % revenue growth and 13 % employment growth, with 13 750 jobs supported (nrc.canada.ca). CIB reports 205 000 jobs created during the construction of its projects and expects 9.7 million tonnes of annual GHG reductions (cdn.cib-bic.ca).
BDC emphasizes the scale‑up of its investee companies but does not quantify job creation. RDAs provide project‑level case studies but no aggregate outcome metrics. Standardising outcome metrics—jobs, revenue growth, exports, patents, emissions—would allow cross‑programme comparisons.
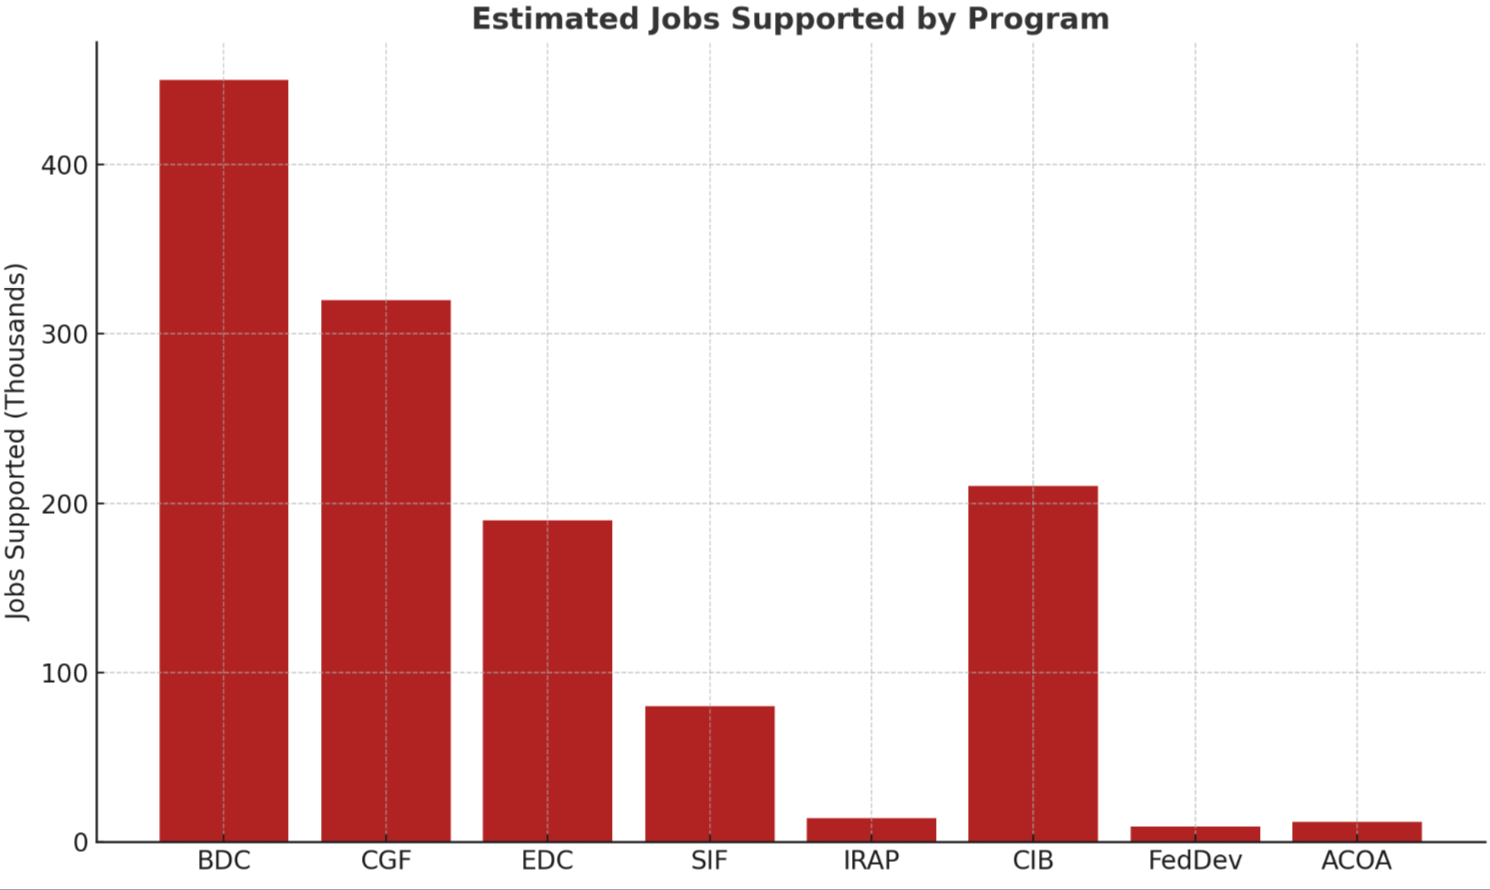
Figure 3: Approximate Job Growth Attributed to Programs)
Market Gaps and More:
Program mandates differ. BDC and EDC typically invest where private capital is scarce (seed, clean tech, export financing), whereas RDAs often support community projects or tourism.
IRAP fills the early‑stage R&D gap for SMEs. SIF targets large transformative projects, sometimes drawing criticism for supporting established firms. The folding of SDTC into IRAP underscore that governance and accountability are essential for maintaining public trust (betakit.com).
Overlaps may arise when multiple programmes target the same sector (e.g., semiconductors), risking duplication of due diligence and raising co‑ordination challenges.
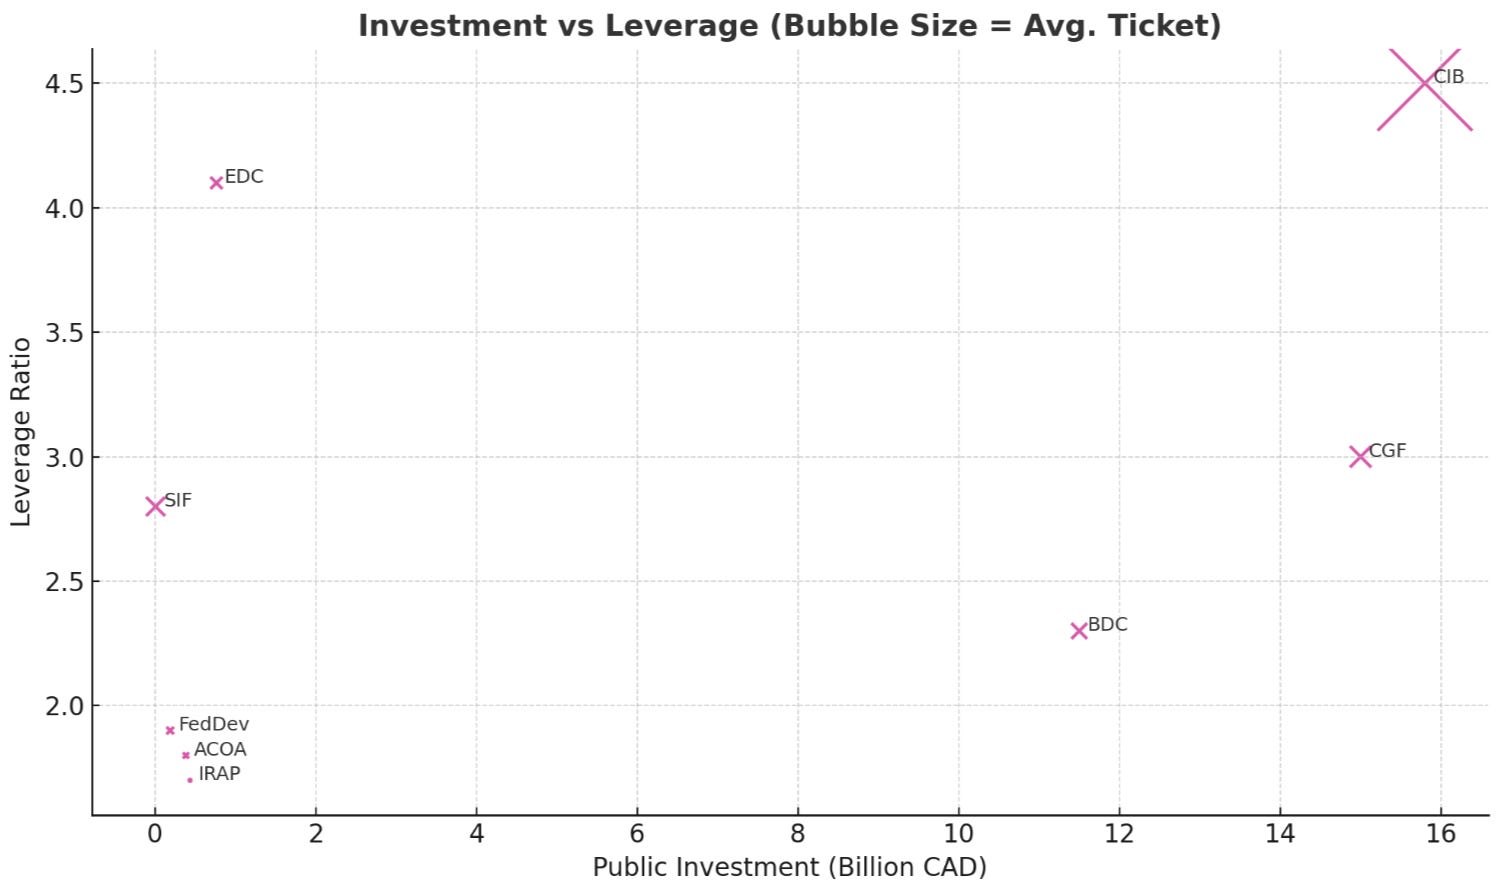
Figure 4: Relationship between program size, leverage, and ticket magnitude.
Comparative Analysis and International Context
Comparing Canada’s programmes with international peers highlights strengths and areas for improvement:
United States: The Small Business Innovation Research (SBIR) and Small Business Technology Transfer (STTR) programs award grants and contracts to SMEs for early‑stage research. They emphasize phased funding with performance milestones and require commercialization plans. Canada’s IRAP plays a similar role but could adopt more formal phase‑gating.
United Kingdom: The British Business Bank (BBB) manages venture capital funds and loan guarantees. Its programs emphasize transparency and publish portfolio companies. Canada’s BDC could enhance disclosure by publishing anonymized investment performance data.
European Union: The European Investment Bank (EIB) and European Innovation Council (EIC) provide large‑scale financing and blended finance instruments. The EIB’s “Innovation Fund” uses carbon contracts for difference similar to CGF. Canada’s CGF is therefore aligned with global best practices but could benefit from the EIB’s reporting frameworks.
Policy Recommendations
Improve Transparency and Data Reporting: Require all federally funded programmes to publish annual investment lists (company, amount, instrument, region) and leverage ratios. Adopt a common data schema to facilitate analysis and reduce duplication of effort.
Coordinate Mandates and Share Due Diligence: Establish a central coordinating body or digital platform where programmes can share due‑diligence reports, avoiding overlaps—particularly in sectors like semiconductors and clean tech. This would accelerate deal timelines.
Standardize Outcome Metrics: Develop a federal framework for measuring outcomes (jobs, revenue growth, exports, patents, emissions reductions) and require programmes to report them annually. This would allow policymakers to evaluate impact and reallocate resources effectively.
Enhance Regional Equity: Expand funding envelopes for RDAs in under‑served regions (Atlantic, North) and provide targeted instruments (e.g., micro‑equity, revenue‑based financing) to suit local conditions. Encourage provinces without investment corporations to create them, learning from IQ and InBC.
Support Governance and Accountability: Apply lessons from the SDTC governance episode by establishing clear oversight, conflict‑of‑interest policies and periodic third‑party audits for all public investment vehicles.
Conclusion
Public investment programmes play a pivotal role in Canada’s innovation ecosystem and infrastructure modernization. From BDC’s venture funds to CGF’s novel carbon contracts for difference, these programs supply billions of dollars to early‑stage firms, growth companies and strategic projects.
The research confirms that direct funding often fills market gaps and catalyses private investment, but the lack of standardized data hampers comprehensive evaluation.
By improving transparency, coordinating mandates, standardizing outcome metrics and addressing regional imbalances, Canada can maximize the impact of its public capital and better support entrepreneurs, industrial transformation and net‑zero objectives.